Optimizing applications on Kubernetes using Machine Learning
Hint: This post has been happily sponsored by StormForge, the company building the product that is being used. Despite sponsorship, they allowed me to share my honest opinion. Huge thanks for their trust and support!
intro
Manually optimizing an application on Kubernetes is hard, especially if your goal is to keep costs low. There are plenty of options, the dependency trees in modern microservice architectures are getting bigger and bigger and for some (most?) of us all of this takes place on hardware that we have no control over.
Additionally without a lot of testing and monitoring effort it’s very difficult to determine the “correct” specs for your deployments. It requires extensive trial and error to push your application into the area where it still performs without being overprovisioned.
Otherwise you’ll end up wasting resources (and thus money) or with a system that falls apart as load increases. That’s why I decided to take a look at StormForge, a tool that aims to solve this problem without occupying endless amounts of engineering time called StormForge Optimize.
Optimizing with StormForge
StormForge is a SaaS product that combines trial and error experiments with machine learning to help you determine configurations that will optimize your application for the metrics you care about. It also includes Performance Testing to place load on your system in a test environment, but for this blog I’ll focus on StormForge’s optimization capabilities. This includes three key components:
- the StormForge Kubernetes controller, handling the experiment execution and the communication with the machine learning (ML) model
- the ML model, responsible for selecting the parameter sets for each trial based on previous results
- the StormForge dashboard, allowing you to analyze and export the resulting configurations of your experiments during and after the execution
Below you can find a visualization that explains the general workflow of an StormForge experiment.
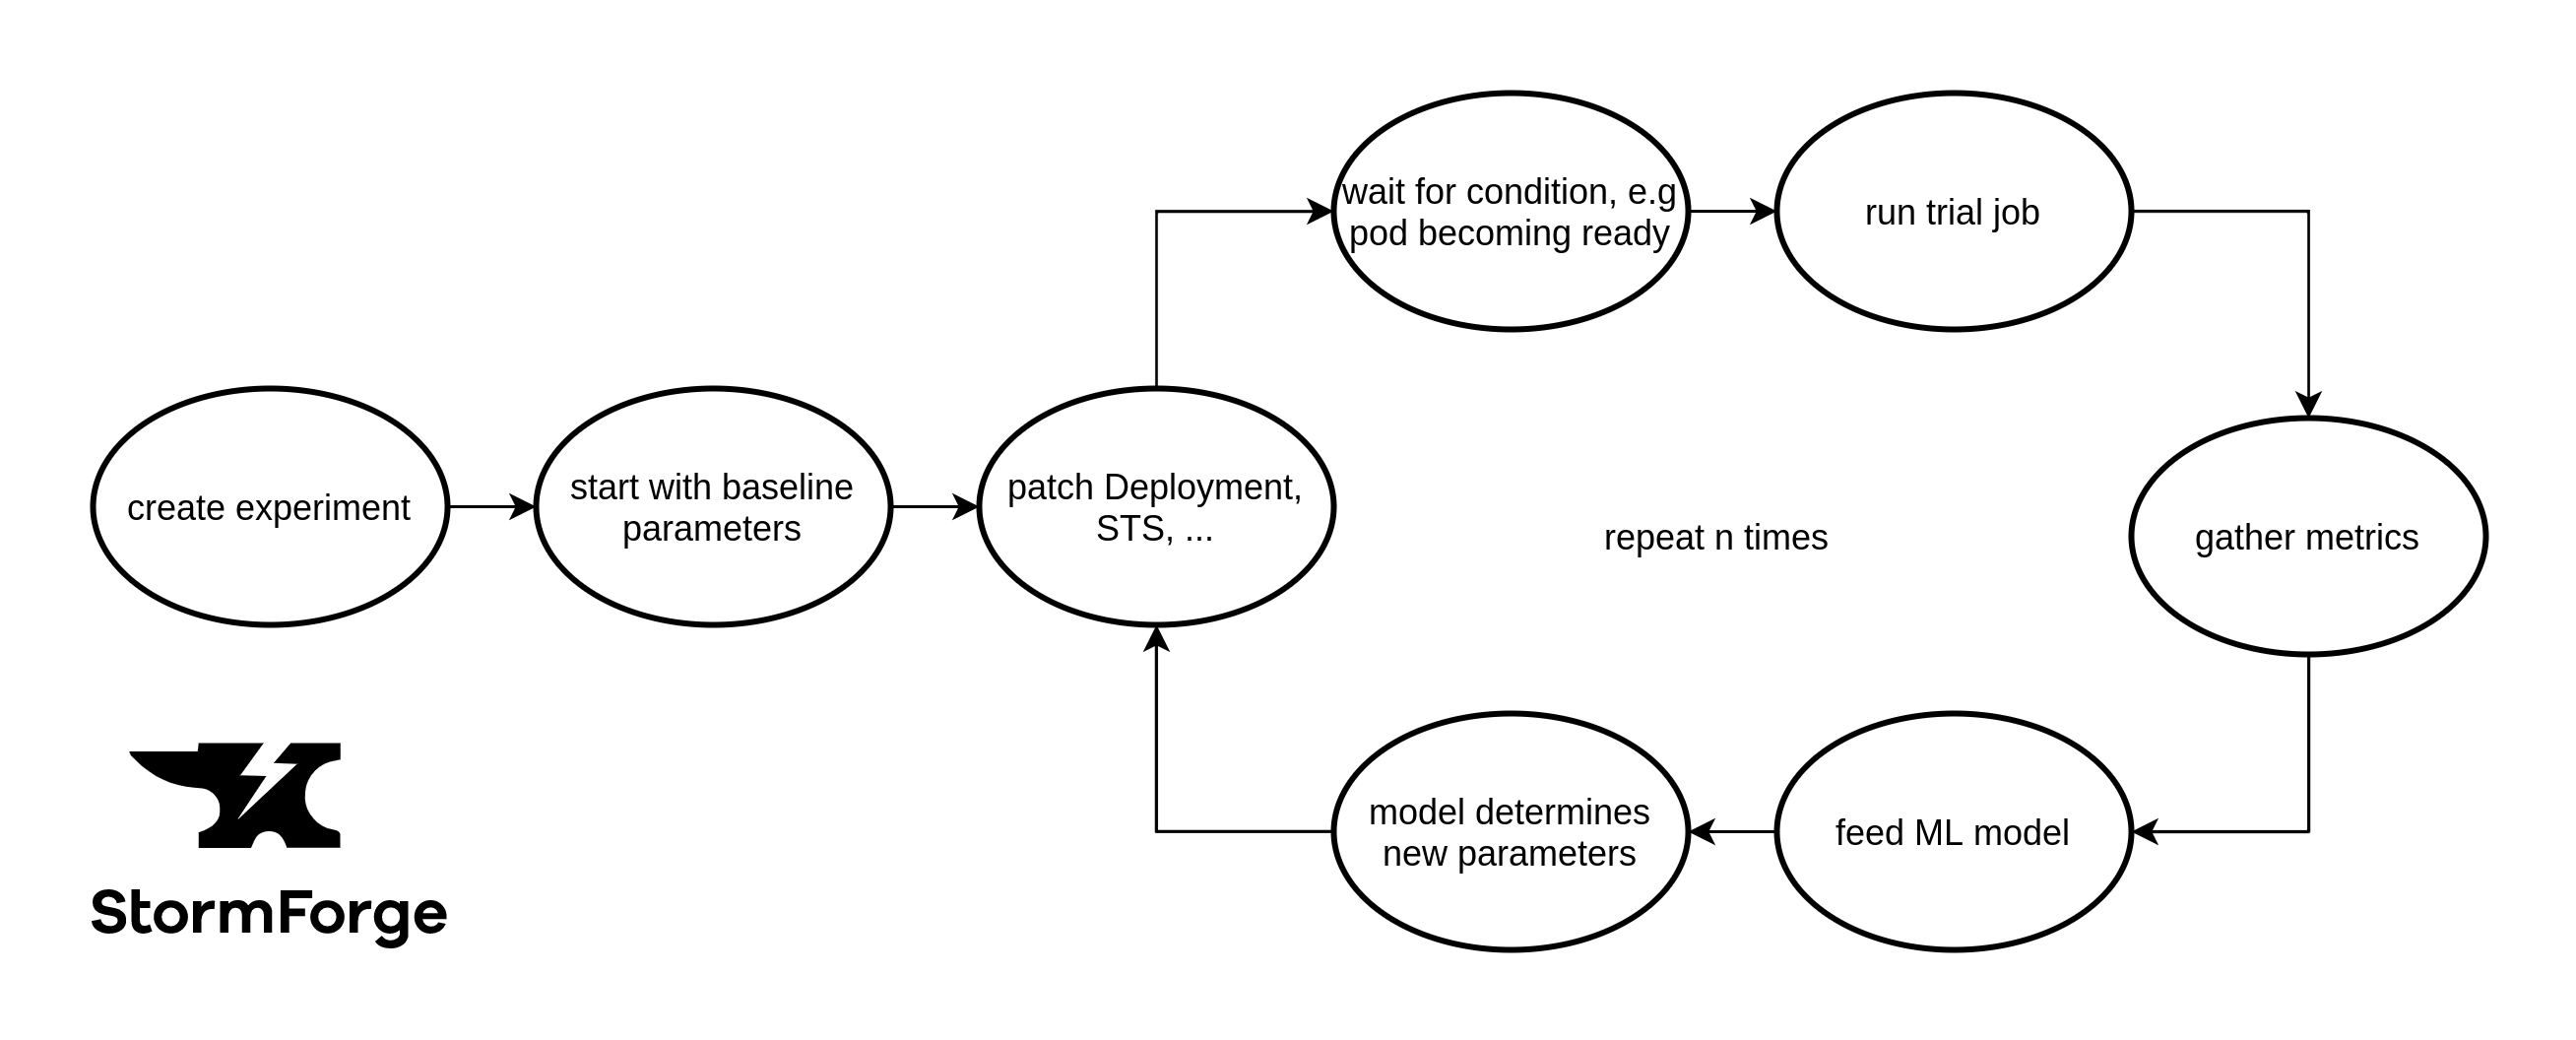
- You start by creating an experiment, including your parameters and metrics you want to optimize.
- The baseline values of your parameters will act as a starting point.
- Your Kubernetes application (defined by a Pod, Job, Deployment, StatefulSet or DaemonSet) will be patched with these parameter values.
- StormForge will wait for a certain condition. Usually this will be your application getting ready to process incoming requests.
- A trial job will be executed putting your application under load.
- Metrics, that you can freely define, will be collected.
- The gathered metrics + the parameters of this run will be fed into StormForge’s machine learning model.
- Based on that, the ML model will determine new parameter values.
- Steps 3 to 8 will be repeated for a configurable amount of times.
Over the course of a single experiment, StormForge will be able to predict configurations that will exceed the performance of your baseline values, based on the metrics you defined.
As Kubernetes is StormForge’s primary target platform, you interact with it using the manifests, a concept you are probably already familiar with. The main one being the Experiment manifest, which consists of the following parts:
Optimization
The optimization section allows you to set the number of iterations that the experiment will go through. Adjust this value according to your use case. Integrating StormForge experiments into your CI pipeline to prevent performance regression? 20 trials may be sufficient.
Wanting to create a baseline configuration for your newly written application? Let StormForge cycle through 200 iterations and leave it running overnight to get the most accurate result.
Example:
1
2
3
4
5
...
  optimization:
  - name: "experimentBudget"
    value: "50"
...
Parameters
Parameters define the possible configuration values that StormForge can experiment with, like the amount of memory, number of replicas or different disk storage types.
As a general rule of thumb increase the number of trials along with your number of parameters. The more permutations your experiment is covering, the more data points the ML model will need to determine the optimal configurations.
Example:
1
2
3
4
5
6
7
8
9
10
11
...
  parameters:
  - name: memory
    min: 500
    max: 2000
    baseline: 1000
  - name: cpu
    min: 500
    max: 2000
    baseline: 500
...
Patches
Patches instruct the StormForge controller how to apply the previously declared parameters to your Kubernetes manifests. This is where StormForge’s biggest strength is in my opinion as you can patch everything that is configurable through a Kubernetes manifest.
It may start with simple things like CPU and memory resource limits. But with more and more extensions coming to Kubernetes lately the possibilities are endless. One example I can imagine is using Crossplane to cycle through VM types of different cloud providers and see on which one your application performs best.
Example:
1
2
3
4
5
6
7
8
9
10
11
12
...
  patch: |
    spec:
      template:
        spec:
          containers:
          - name: my-app
            resources:
              limits:
                memory: "{{ .Values.memory }}Mi"
                cpu: "{{ .Values.cpu }}m"
...
Trial template
The trial template specifies what your application-specific performance measurement looks like. Internally it launches a Kubernetes Job which gives you the freedom of using your tool of choice, like StormForge’s own load testing solution, or another tool like Locust or Gatling.
Also you can take care of some preparation tasks like deploying a Helm chart or a dedicated Prometheus instance. Be aware that trial jobs will be executed on the same Kubernetes cluster as your application under test. So be sure to keep room for its potential additional CPU and RAM usage.
Example for a PostgreSQL load test trial template:
1
2
3
4
5
6
7
8
9
10
11
12
13
14
15
...
  template:
    spec:
      initialDelaySeconds: 15
      template:
        spec:
          template:
            spec:
              containers:
              - image: crunchydata/crunchy-pgbench:centos7-11.4-2.4.1
                name: pgbench
                envFrom:
                - secretRef:
                    name: postgres-secret
...
Metrics
Metrics allow you to define the criteria that you want to gather and/or optimize, e.g. minimizing the costs while maximizing the throughput of your application. StormForge comes with certain metrics out of the box, like trial duration, but can also query popular monitoring systems like Prometheus or Datadog if you are looking to optimize more specific metrics.
Example:
1
2
3
4
5
6
7
8
9
10
11
12
13
14
...
  metrics:
  - name: duration
    minimize: true
    query: "{{duration .StartTime .CompletionTime}}"
  - name: cost
    minimize: true
    type: pods
    # calculating with $20/month/CPU core and $3/month/GB of RAM
    query: '{{resourceRequests .Pods "cpu=0.020,memory=0.000000000003"}}'
    selector:
      matchLabels:
        component: my-app
...
For more information check out StormForge’s documentation which covers all these elements in more detail.
getting started
With all the concepts clarified let’s prepare our application and cluster for the first experiment. To begin with we have to decide on an application that we want to optimize. I went with Apache Cassandra because I always see it using huge amounts of resources in Kubernetes clusters and wanted to check whether this can be improved.
So I went ahead and created a standard StatefulSet that takes care of deploying my Cassandra pods. Additionally we’ll need some way of putting load onto the database during the trial job. Luckily, Cassandra comes with a tool to do just that, called cassandra-stress.
1
2
3
4
5
6
7
8
9
10
11
12
13
14
15
16
17
18
19
20
21
...
  template:
    spec:
      template:
        spec:
          containers:
          - image: cassandra:4.0
            name: cassandra-stress
            # making sure that our trial job does not eat up endless amounts of resources
            resources:
              limits:
                memory: "1024Mi"
                cpu: "2000m"
            command:
            - bash
            - -c
            - |
              CASSANDRA_URL="cassandra.default.svc.cluster.local"
              /opt/cassandra/tools/bin/cassandra-stress write n=100000 -rate threads=400 -node $CASSANDRA_URL
              /opt/cassandra/tools/bin/cassandra-stress mixed n=100000 -rate threads=400 -node $CASSANDRA_URL
              cqlsh --request-timeout=60 -e "DROP KEYSPACE keyspace1;" $CASSANDRA_URL || true
As you can see our trial job consists of the following three steps:
- measuring write performance while prepopulating the cluster at the same time
- measuring mixed (~50:50 read and write) performance
- dropping the keyspace to make sure each test run starts in a clean environment
Because we always execute the same number of read and write operations (2 x 10000), simply measuring the time of the trial job to complete will be a good way to judge how our database performs.
With our application good to go, let’s quickly prepare our Kubernetes cluster. Assuming you have a connection to it set up, after installing the redskyctl CLI tool the following commands will deploy the StormForge controller.
1
2
3
4
5
6
7
8
9
10
11
12
13
14
15
16
17
18
$ redskyctl login # log into our StormForge account
Opening your default browser to visit:

        https://auth.carbonrelay.io/authorize?...

You are now logged in.
$ redskyctl init # deploy the StormForge controller
customresourcedefinition.apiextensions.k8s.io/experiments.redskyops.dev created
customresourcedefinition.apiextensions.k8s.io/trials.redskyops.dev created
clusterrole.rbac.authorization.k8s.io/redsky-manager-role created
clusterrolebinding.rbac.authorization.k8s.io/redsky-manager-rolebinding created
namespace/redsky-system created
deployment.apps/redsky-controller-manager created
clusterrole.rbac.authorization.k8s.io/redsky-patching-role created
clusterrolebinding.rbac.authorization.k8s.io/redsky-patching-rolebinding created
secret/redsky-manager created
$ redskyctl check controller --wait # wait for the controller to become ready
Success.
starting simple
After going through the preparation phase we can start with our first experiment. To keep it simple, we will start with two parameters (CPU and memory limits) and a single metric (duration of our trial) that we want to optimize. Below you can see the relevant parts of the experiment spec:
1
2
3
4
5
6
7
8
9
10
11
12
13
14
15
16
17
18
19
20
21
22
23
24
25
26
27
28
29
30
31
32
33
...
  parameters:
  - name: memory
    min: 1000
    max: 4000
    baseline: 2000
  - name: cpu
    min: 500
    max: 3500
    baseline: 1000
  patches:
  - targetRef:
      kind: StatefulSet
      apiVersion: apps/v1
      name: cassandra
    patch: |
      spec:
        template:
          spec:
            containers:
            - name: cassandra
              resources:
                limits:
                  memory: "{{ .Values.memory }}Mi"
                  cpu: "{{ .Values.cpu }}m"
                requests:
                  memory: "{{ .Values.memory }}Mi"
                  cpu: "{{ .Values.cpu }}m"
  metrics:
  - name: duration
    minimize: true
    query: "{{duration .StartTime .CompletionTime}}"
...
After roughly 1.5 hours we end up with the following chart in the StormForge dashboard.
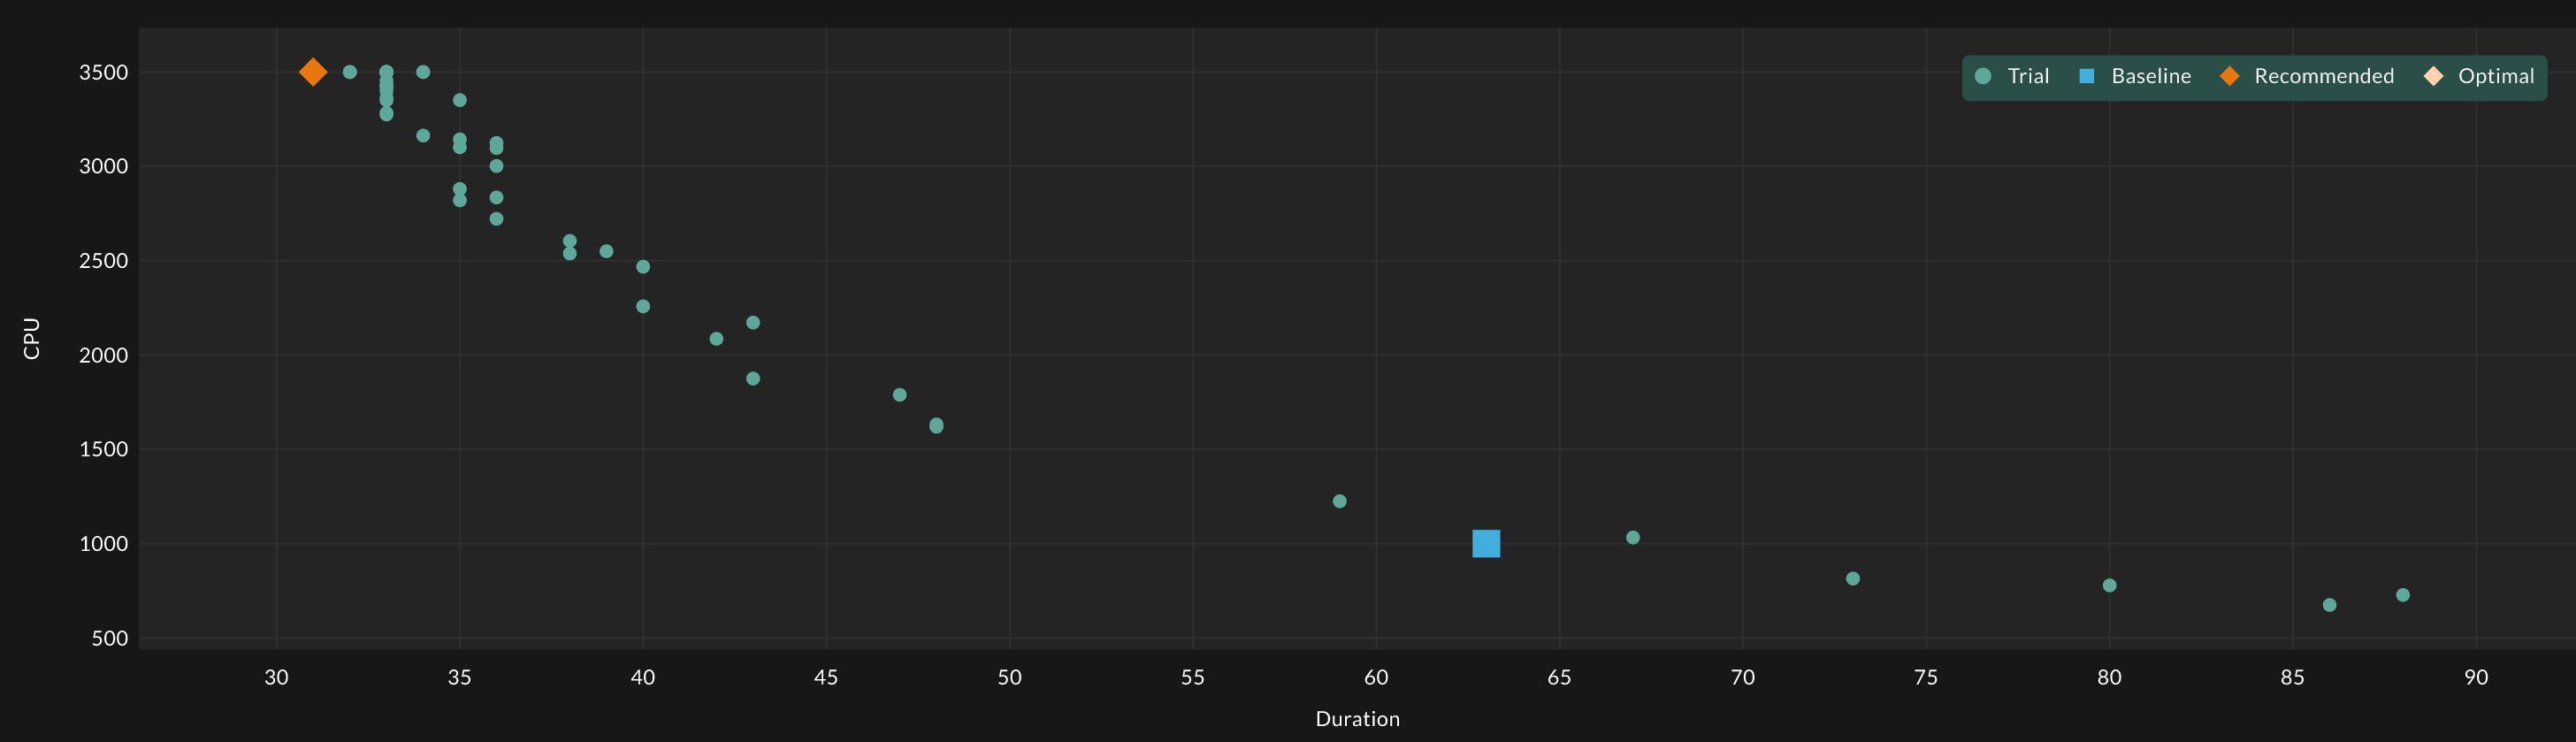
As you may have already guessed, the results are not really surprising. The more resources that fuel your application, the better it will perform. Who would’ve thought? Anyway, I think this experiment is valuable for the following two reasons.
First, it’s a simple showcase to understand how StormForge works, and second it helped us validate our assumptions. Imagine if Cassandra performed worse with more resources or the trial duration turned out to be completely random. In this case we would know that something in our test setup is messed up. Instead we now can jump onto our first proper experiment with confidence.
adding another dimension
So let’s add another dimension of metrics. In most real world scenarios you try to achieve the best performance while keeping the resource usage as low as possible. And that’s exactly what we will be trying to do. As a general rule of thumb for all kinds of optimization, you should always try to optimize at least two metrics that contradict each other, like increasing throughput while decreasing CPU usage or reducing latency while minimizing cache size.
We will be combining the CPU and memory usage into a single cost estimation metric by using the resourceRequests function which allows us to create a weighted sum of the two. The parameters will stay the same while the metrics change to the following:
1
2
3
4
5
6
7
8
9
10
11
12
13
14
15

...
  metrics:
  - name: duration
    minimize: true
    query: "{{duration .StartTime .CompletionTime}}"
  - name: costs
    type: pods
    # weights are equal to AWS EC2 pricing of c5.xlarge instance ($30.60/month/CPU core,$15.30/month/GB RAM)
    query: '{{resourceRequests .Pods "cpu=0.03060,memory=0.000000000001530"}}'
    selector:
      matchLabels:
        component: cassandra
...
After applying our Experiment manifest we can have a look at the individual trials runs using kubectl like so:
1
2
3
4
5
6
7
8
9
10
$ kubectl get trials -o wide -w
NAME                          STATUS      ASSIGNMENTS             VALUES
cassandra-two-metrics-1-000   Completed   memory=2000, cpu=1000   duration=69, costs=33.808642559999996
cassandra-two-metrics-1-001   Completed   cpu=2845, memory=3003   duration=36, costs=91.87477680384
cassandra-two-metrics-1-002   Completed   cpu=1782, memory=2886   duration=47, costs=59.15927121407999
cassandra-two-metrics-1-003   Completed   cpu=1529, memory=3225   duration=51, costs=51.961336128
cassandra-two-metrics-1-004   Completed   cpu=728, memory=3403    duration=87, costs=27.73630531584
cassandra-two-metrics-1-005   Completed   cpu=537, memory=2269    duration=107, costs=20.07240498432
cassandra-two-metrics-1-006   Completed   cpu=1929, memory=4000   duration=41, costs=65.44468512
...
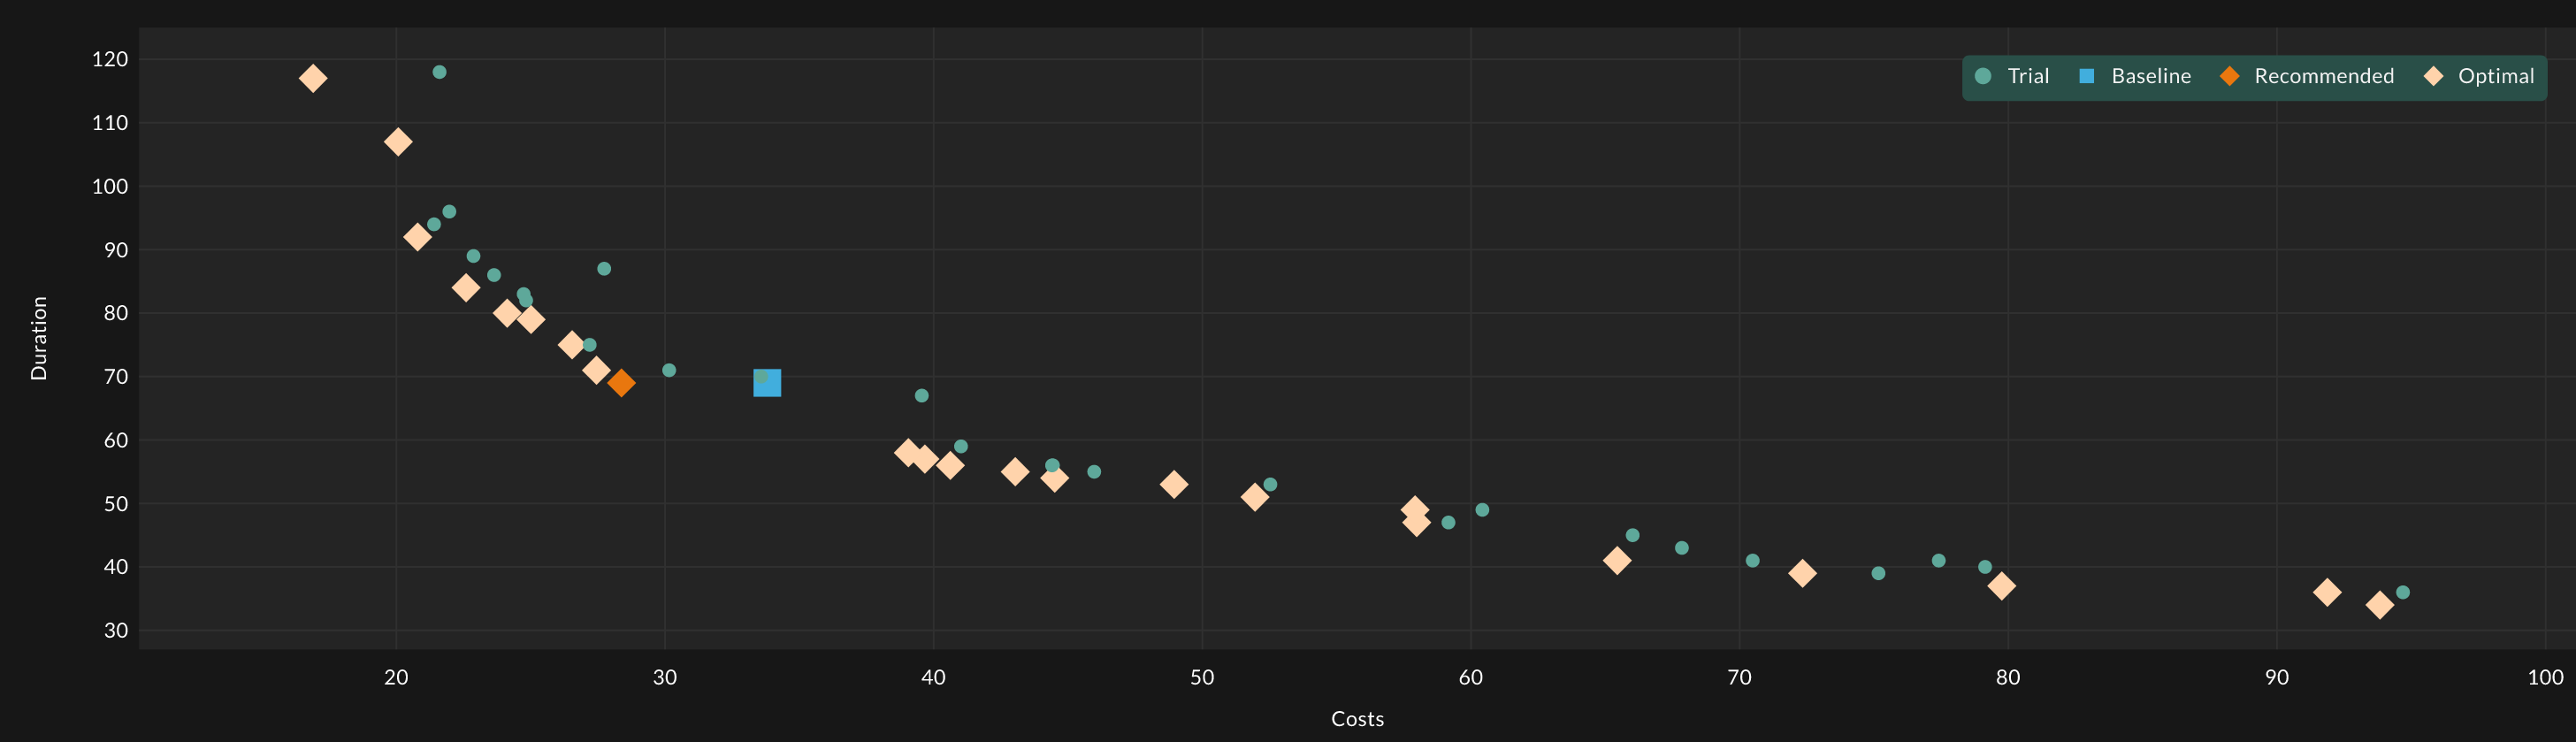
Now that we have a chart with more useful information here’s an explanation of the different data points:
- The blue square represents the result of our baseline configuration, in our case 1 CPU core and 2 GB of RAM which resulted in a trial job duration of 69 seconds.
- Green circles stand for “normal” trial runs. Those can mostly be ignored as they were outperformed by others.
- The beige squares show the trial runs that performed well and give you a variety of choices depending on how you prioritize lowering costs versus increasing performance.
- The orange square represents the trial run that StormForge selected as the sweet spot, in our case decreasing the costs by 16% while achieving the same trial run duration.
After selecting the trial run that fits our needs, we can export the new application configuration using the redskyctl tool. I’ll go with StormForge’s recommended trial that decreased the costs by 16% while achieving the same duration run.
1
2
3
4
5
6
7
8
9
10
11
12
13
$ redskyctl export -t \ # export the patched resource
  -f cassandra.yaml \ # path to the Cassandra STS manifest
  -f experiment.yaml \ # path to the Experiment manifest
  cassandra-two-metrics-1-015 # the trial run with our desired configuration
...
  resources:
    limits:
      cpu: 875m
      memory: 1000Mi
    requests:
      cpu: 875m
      memory: 1000Mi
...
Comparing this configuration to our baseline values of 1000m CPU shares and 2000Mi memory we were able to save quite a bit of resources. While the CPU improvement is probably based on a bit of wriggle room of the trial run duration, the RAM savings definitely confirm that Cassandra is running perfectly fine with half of our original value.
Please be aware that the outcome of StormForge experiments is only meaningful if your load test is very similar to what your application is being exposed to when running in production. That’s why you should select a load generation tool that is capable of doing so.
conclusion
So there you have it. A basic example of optimizing Cassandra on Kubernetes by letting software take care of tedious and repetitive tasks and thereby figuring out to which position certain knobs should be set. Of course this example could have been extended endlessly by adding more and more parameters, like JVM heap size, different disk types or various compression algorithms.
But as all of those very much depend on your use case and the capabilities of your infrastructure, I’d be very happy if you are able to do that on your own using StormForge after reading this blog post. If there are any open questions, feel free to reach out to them.